Coordinate Geometry: The Secret Language That Turns Numbers Into Pictures
How does a weather app draw a temperature trend? How does a video game know exactly where your character stands on screen? The answer starts with two lines that cross at a single point your child already knows: the x-axis and y-axis.
Why Two Crossing Lines Became a Universal Picture Language
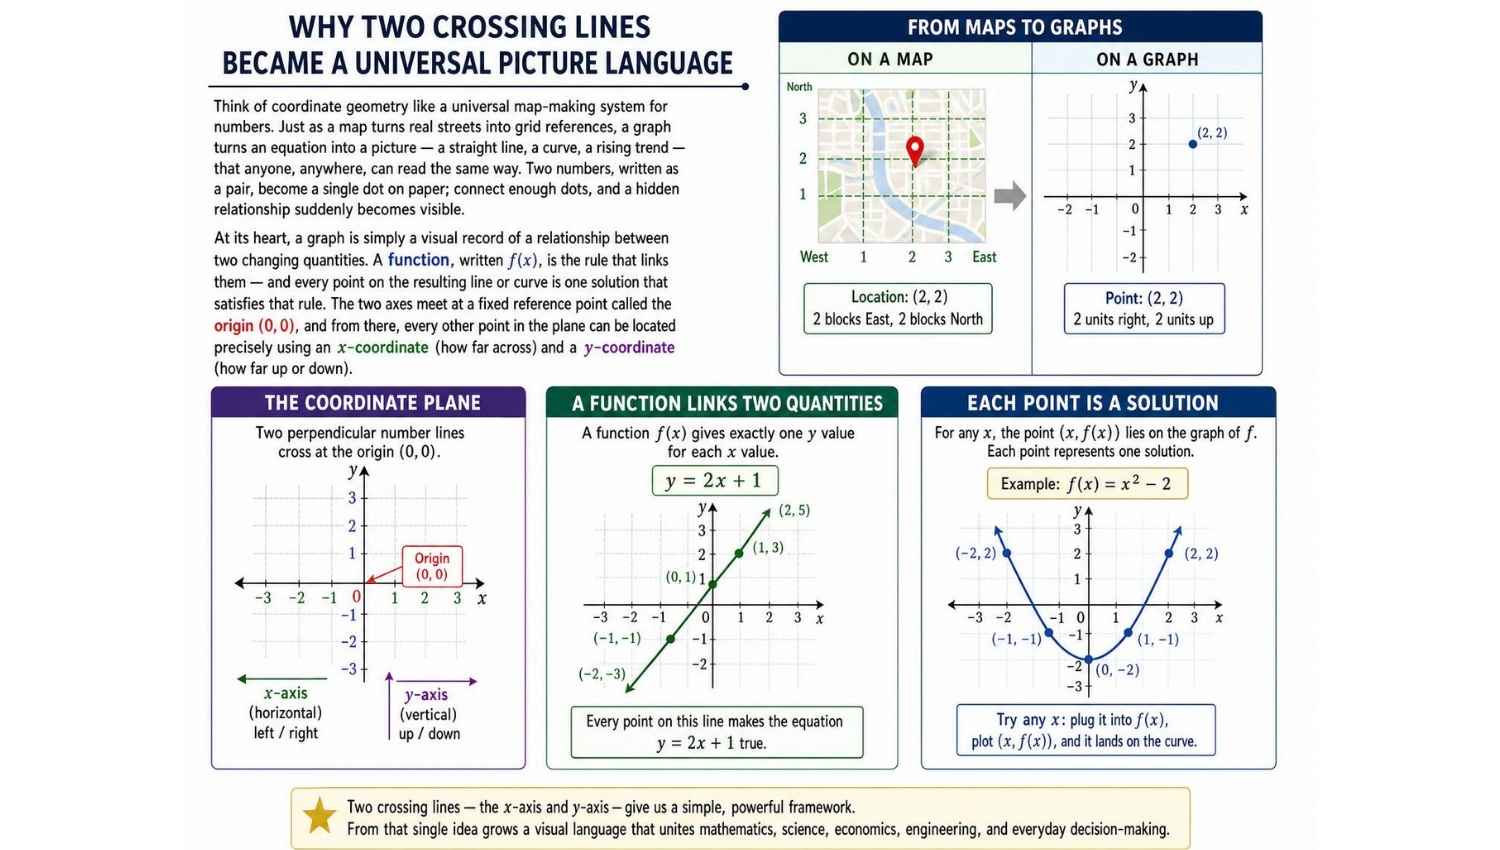
Think of coordinate geometry like a universal map-making system for numbers. Just as a map turns real streets into grid references, a graph turns an equation into a picture — a straight line, a curve, a rising trend — that anyone, anywhere, can read the same way. Two numbers, written as a pair, become a single dot on paper; connect enough dots, and a hidden relationship suddenly becomes visible.
At its heart, a graph is simply a visual record of a relationship between two changing quantities. A function, written f(x), is the rule that links them — and every point on the resulting line or curve is one solution that satisfies that rule. The two axes meet at a fixed reference point called the origin (0,0), and from there, every other point in the plane can be located precisely using an x-coordinate (how far across) and a y-coordinate (how far up or down).
The Anatomy of a Graph
Every graph on the Cartesian plane is built from the same essential parts. Once a child can name and locate each one, reading any graph — no matter how complex — becomes far less intimidating.
The Origin (0,0)
The fixed point where the x-axis and y-axis intercept. Every other point is measured relative to it.
Coordinates (x, y)
An ordered pair that pinpoints one exact location on the plane — x first, then y, always in that order.
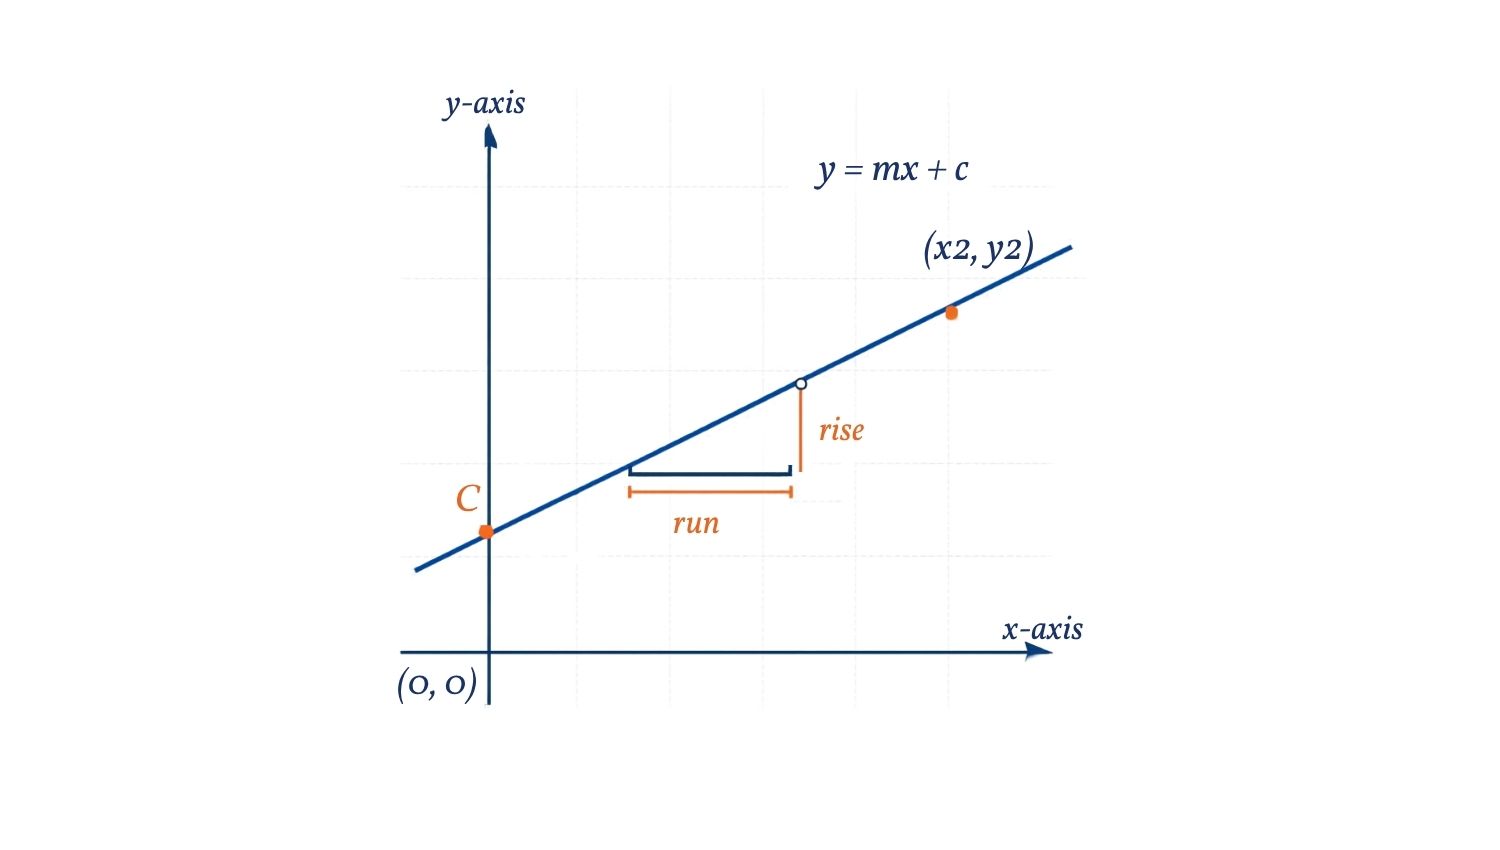
Gradient (m)
How steep a line is — found by dividing the rise (change in height) by the run (change in width).
y-Intercept (c)
The exact point where a line crosses the y-axis — the starting height before the line begins to rise or fall.
Plotting a Linear Equation: y = mx + c
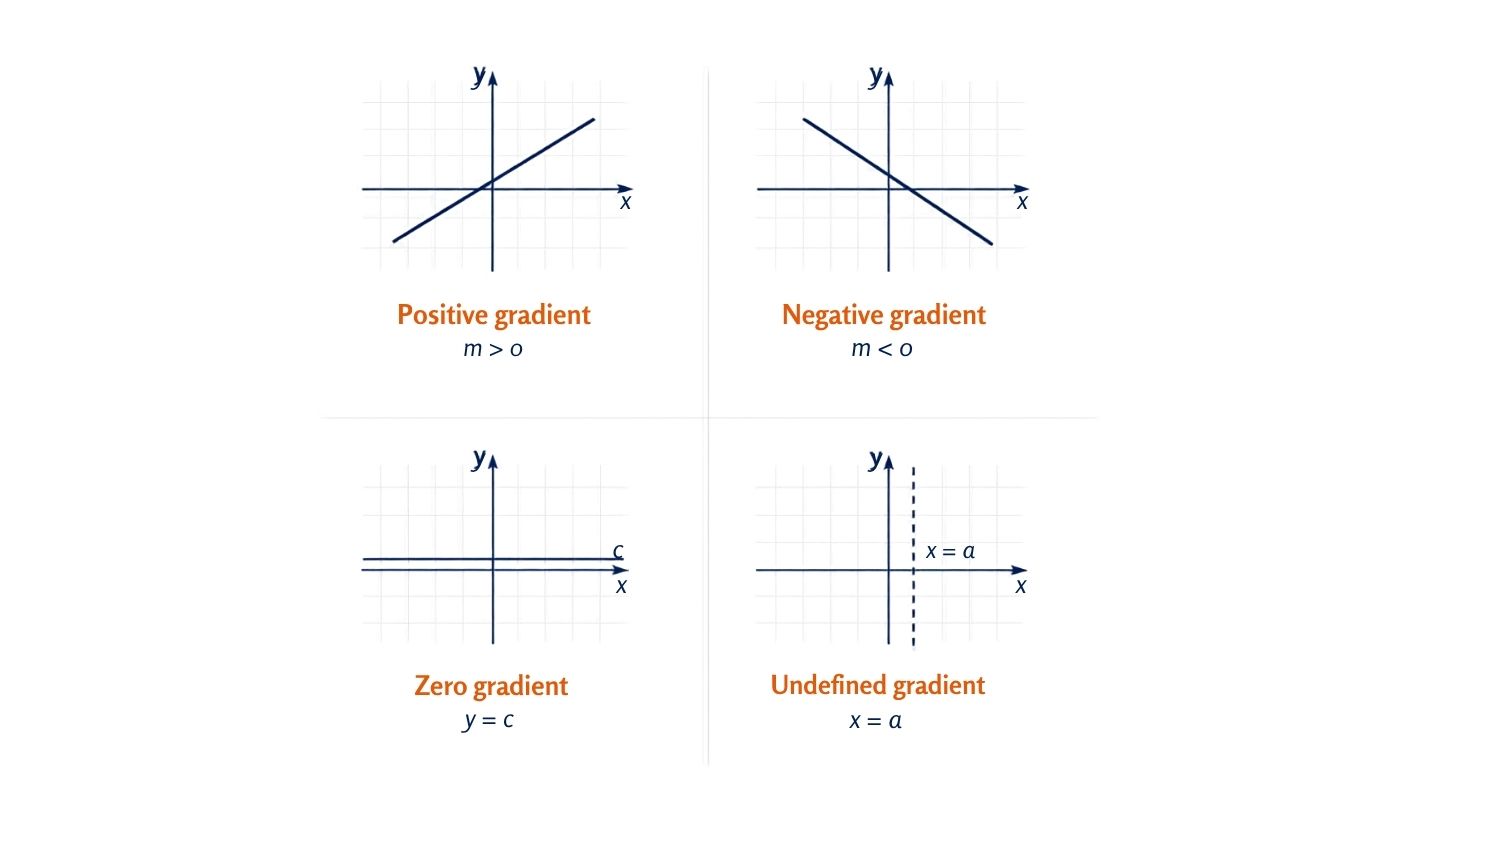
A straight-line graph is described by a linear equation in the form y = mx + c, where m is the gradient and c is the y-intercept. When plotted on graph paper, every value of x and y that satisfies the equation lines up perfectly to form one continuous straight line.
m < 0 → line slopes downward (left to right)
m = 0 → horizontal line, y = c
m is undefined → vertical line, x = a (intercepts x-axis at a)
Plotting a Parabola: y = x²
A quadratic graph plots the relationship between x and y for a quadratic equation, creating a distinctive U-shaped curve called a parabola. Every parabola has a vertex — its lowest point (if it opens upward) or highest point (if it opens downward) — and is perfectly symmetrical about a vertical line drawn through that vertex.
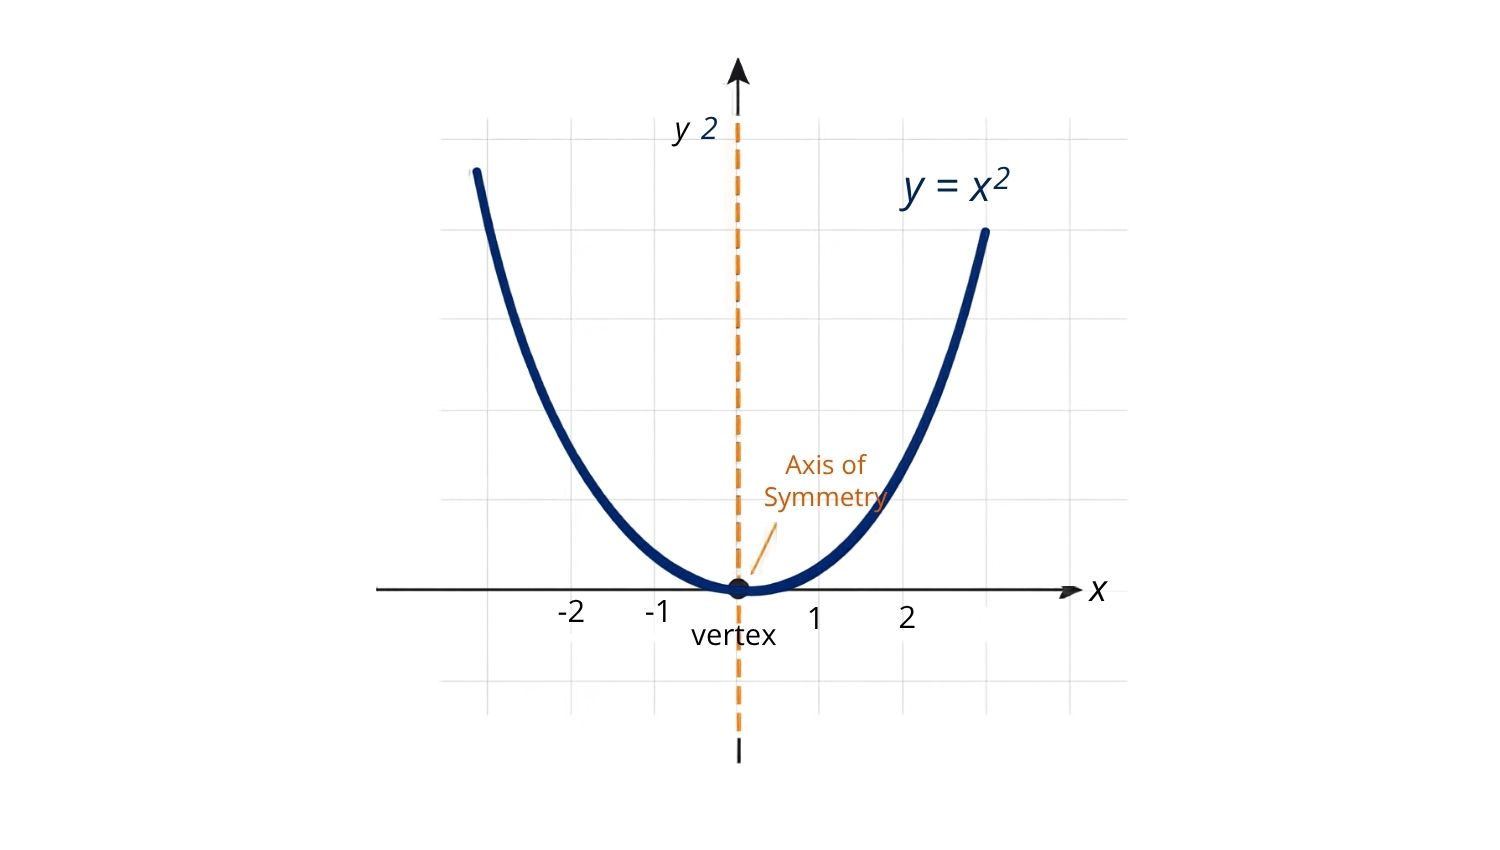
Fig 2: The parabola y = x², with its vertex at the origin and a dashed line of symmetry running through it.
Reading the Shape of a Curve
Beyond straight lines and simple parabolas, coordinate geometry introduces a family of curve shapes that each behave in a predictable, recognisable way.
1 Positive Curve
y = x² — opens upward, vertex at the bottom, forming a "smile" shape.
2 Negative Curve
y = −x² — opens downward, vertex at the top, forming a "frown" shape.
3 Rising Exponential
y = pa^x (a > 1) — curves upward increasingly steeply, never touching the x-axis.
4 Falling Exponential
y = −pa^x (a > 1) — curves downward increasingly steeply, mirrored below the x-axis.
How Many Times Does a Curve Cross the x-Axis?
A quadratic equation in the form ax² + bx + c = 0 produces a U-shaped curve whose relationship with the x-axis reveals exactly how many real solutions the equation has — without needing to solve it algebraically first.
A Two Real Solutions
The curve crosses the x-axis at two distinct points — two different values of x satisfy the equation.
B One Real Solution
The curve's vertex just touches the x-axis at a single point — one repeated value of x.
C No Real Solution
The curve never touches the x-axis at all — no real value of x satisfies the equation.
Finding the Equation of a Straight Line: A Step-by-Step Walkthrough
Here is the exact thought process your child should follow whenever a question gives two points on a line and asks for the line's equation.
The Gradient Method
Finding the equation of a straight line passing through two known points, A and B.
A straight line passes through point A (1, 2) and point
B (4, 3).
Find the equation of the line.
📖 Step-by-Step Solution
For any two points A(x₁, y₁) and B(x₂, y₂) on a straight line, the gradient relationship is:
Using A(1, 2) as (x₁, y₁) and B(4, 3) as (x₂, y₂):
Multiply both sides by (x − 1), then expand:
y = (1/3)x + 1 2/3
Common Obstacles Children Face — And What Parents Can Do About Them
Coordinate geometry rewards careful, methodical reading of a graph. Knowing exactly where students typically go wrong lets parents intervene early.
⚠️ Swapping x and y
Students plot (3, 5) as if it were (5, 3), reversing horizontal and vertical movement.
⚠️ Miscalculating Gradient
Students divide run by rise instead of rise by run, inverting the slope value.
⚠️ Confusing y-Intercept with x-Intercept
Students substitute the wrong axis when reading where a line "starts."
⚠️ Misreading Parabola Direction
Students forget that a negative coefficient flips the curve to open downward.
How Singapore's Curriculum Builds Graphing Fluency
Singapore builds coordinate geometry as a natural extension of number lines and ratio, using the Concrete–Pictorial–Abstract (CPA) approach that underpins the national mathematics syllabus.
Concrete: Grid Paper and Physical Plotting
Students physically plot points on graph paper using counters or pencil dots, building a felt sense of "across then up."
Pictorial: Reading and Drawing Lines
Students connect plotted points to see a line or curve emerge, discovering patterns before formulas are introduced.
Abstract: The Equation Forms
y = mx + c and quadratic equations are introduced as formal descriptions of relationships already seen and drawn by hand.
Application: Real-World Graph Problems
Students interpret travel graphs, conversion graphs, and data trends — mirroring real exam and real-life contexts.
Spiral Revisit: Secondary Extension
The topic resurfaces from Primary 5 through Secondary 3, extending into simultaneous equations and calculus foundations.
How Coordinate Geometry Shows Up in the Real World
Graphs rarely announce themselves — but they work silently behind almost every chart, trend, and tracking tool we rely on every day.
Fig 4: A distance-time graph of three runners in a race — the steeper the line, the greater the runner's speed at that moment.
📊 Data & Weather Tracking
Weather apps plot temperature or rainfall against time, letting families read trends instantly.
💰 Personal Finance
Savings and spending graphs plot money against time, helping households visualise growth or overspending.
🏃 Sports Science
Coaches use distance-time and speed-time graphs to analyse an athlete's performance during a race.
🗺️ GPS & Digital Maps
Every location pin on a digital map is stored and calculated as a coordinate pair, just like (x, y) on graph paper.
🎮 Video Games & Animation
Every character's position and movement path on screen is tracked using coordinate points updated frame by frame.
🏗️ Engineering & Architecture
Bridge cables and arches are designed using parabolic curves, calculated with the same y = x² family of equations.
Why Early Mastery of Graphing Skills Shapes a Child's Learning Trajectory
Coordinate geometry is often a child's first real bridge between numbers and pictures — the moment abstract algebra becomes something they can see, touch, and reason about visually. Children who build this visual-numeric connection early tend to find later topics such as statistics, calculus, and even physics far less intimidating, because they have already learned to "see" an equation rather than merely calculate it.
Just as importantly, graphing builds a transferable habit of mind: breaking a big, messy relationship into small, checkable steps — plot a point, check it fits, connect the dots, read the pattern. This habit of patient, structured reasoning is exactly what Singapore's curriculum designers intend, and it serves children well far beyond the mathematics classroom.
Start Today: Your Child's Graphing Journey Begins at Home
Ask one simple question next time you see a chart in the news: "What do you think is happening at the steepest part of this line?"
🎯 Your Action Plan This Week
- Print a labelled Cartesian plane — with the origin, x-axis, and y-axis clearly marked. Stick it above the study desk.
- Practise plotting five random coordinate pairs — say them aloud as "across then up" before marking each point.
- Draw a simple travel graph together — plot your family's distance from home over a day out, then discuss what each slope means.
- Compare a positive and negative parabola side by side — sketch y = x² and y = −x² on the same grid and discuss the mirror effect.
- Work through the worked example above together, then reverse it — give the equation and one point, find the missing coordinate.